Sunday, November 27, 2011
Defining Obama: Presidential Image and Narrative in the 2012 Elections
Thursday, November 17, 2011
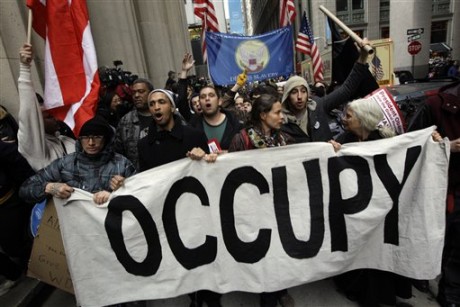
Occupy Wall Street highlights documented structural and political inequalities
Occupy Wall Street (OWS) is a cacophony of voices speaking a simple message about the structural economic and political inequalities in America and around the world. Sharing affinities to the 1999 World Trade Organization protests against globalization, OWS looks to the growing power of global financial institutions and their stranglehold on governments around the world.OWS points to how the Bush and the Obama administrations loaned or credited trillions to banks and the too-big-to-fails to bail them out after they gambled on Wall Street, only to see homeowners face record losses in their houses and illegal foreclosures by these institutions. Tax breaks and loans were provided to the big auto companies but little was done to help the unemployed. The banks of Europe were recapitalized by the International Monetary Fund and the European Central Bank, but Greece and Italy was compelled to take the so-called "haircuts." Democracy has taken a backseat to saving capitalism. This is the message of OWS.
While Rome and the rest of the world burn, Nero fiddles. At least in this case, the fiddling is done by the Republican presidential candidates, who assert that all that ails the economy can be cured by more tax cuts and free markets. But while the GOP fiddles, a host of interesting studies have come out documenting and criticizing the ideology of Herman Cain, Michele Bachmann and company, as well as offering some insights into the state of the American economy. These reports are worth noting since they have received scant notice in the mainstream media.
The rich are getting richer, the poor poorer, no matter how you examine it.
In October a Congressional Budget Office report documented the growth in income in the United States from 1979 to 2007. For those in the top 1 percent bracket, their income increased by 275 percent. For those in the top 20 percent, it increased by 65 percent, for the middle incomes it was a 40 percent increase, and for those in the bottom 20 percent it was scant 18 percent. In 2010, the census reported the richest 5 percent of the population accounted for 21 percent of the income, with the top 20 percent receiving over 50 percent of the total income in the country.
Moreover, the latest census figures point to a poverty rate in 2010 of 15.1 percent, representing a record 46 million people in poverty. But earlier this month the US Census Bureau issued a new report recalculating what constitutes poverty — noting that current estimates are based on an outdated methodology from 1960s. This measure for calculating poverty did not include government transfers (welfare) or tax cuts when making estimates, and it also did not reflect the current spending patterns of Americans. Using new measurement tools, which the Census Bureau calls the "supplemental measure of poverty," the study concluded that the poverty rate is actually 16 percent — higher than the old estimate — constituting more than 49 million individuals in poverty. So much for welfare queens getting rich on the system.
The rich and poor live in separate worlds.
There is a geographic basis to poverty. Generally the assumption is that poverty is concentrated to the urban cores of major cities. One way to measure the spatial dimension to poverty is to use census data. Census tracts where 25 percent or more of the households live in poverty are referred to as high-poverty neighborhoods, and those with 40 percent or more of the households in poverty are referred to as extreme-poverty neighborhoods. Concentrated poverty is a problem because of the issues surrounding low economic opportunity, high government social service costs, and crime.
Looking at concentrated poverty across the United States, the Brookings Institution recently concluded that 10.5 percent of all individuals lived in extreme-poverty neighborhoods, up from 9.1 percent in 2000. Estimates are that more than 15 percent overall live in concentrated-poverty neighborhoods, with the most rapid growth occurring in the suburbs. The Twin Cities metro region is not immune, with 9.4 percent of the population living in concentrated poverty neighborhoods that include some suburbs but mostly the Minneapolis-St Paul urban cores. These trends parallel 2000 census data demonstrating the gravitation of poverty from the cities to the inner ring suburbs, creating really a two-tiered metro region marked by affluence and poverty.
Similarly, in the just released Stanford University/Russell Sage Foundation’s “Growth in the Residential Segregation of Families by Income, 1970-2009,” researchers found that America was becoming increasingly segregated by income. In 1970 only 15 percent of families were living in affluent or poor neighborhoods, but in 2007 it was 31 percent. They researchers also found that high-income households were less likely to be found in mixed-income neighborhoods than the rest of the population. In general the percentage of Americans dwelling in middle-income neighborhoods was dwindling and, in fact, these types of residential neighborhoods were shrinking.
Overall the study noted the increased economic and racial segregation in this country, with individuals of different classes less and less likely to come into contact with those from other social-economic backgrounds. America has become a tale of two cities.
Taxes really are not job killers.
The canned line from the Republican candidates has been this: high taxes are killing the economy and forcing companies out of business. Three reports again reject this contention.
The Bureau of Labor Statistics compiles data on reasons for mass layoffs. In its most recently survey, which covers 2010 and 2011, factors such as cancellation of a contract or order for goods, insufficient demand for products and increased automation account for the vast majority of layoffs. High taxes do not even appear on the list as a reason.
Second, the National Federation of Independent Business (NFIB) recently completed a survey asking small businesses to identify the single biggest problem they face. Taxes came in third, with poor sales listed as the biggest issue.
Third, the Citizens for Tax Justice recently released a report, “Corporate Taxpayers & Corporate Tax Dodgers,” documenting the biggest businesses that have failed to pay their fair share of taxes. Among the worst offenders, corporations such as GE, DuPont, Boeing, and Wells Fargo paid no income taxes from 2008-2010, let alone the theoretical 35 percent statutory corporate rate. The Citizens for Tax Justice report documents scores of blue-chip American companies that failed to pay any taxes during these three years, questioning the claim that high taxes are depressing employment and their economic growth.
Moreover, in addressing the arguments made by Herman Cain and others that high corporate tax rates discourage American companies from repatriating $1.2 trillion in money being held overseas, the Corporate Taxpayers study points out that corporate tax rates in other countries are often significantly higher. Additionally, if there is a tax advantage to off-shoring jobs it comes only because American law allows for a permanent deferral on foreign profits. The solution is simple: repeal the deferral and do not allow corporations to use the tax code as an incentive to out-source. Overall, the United States government is facilitating this problem by adopting policies that encourage evasion.
The message from all these studies point to a nation increasingly divided by income, region, and class. They point to a country where the rich pay little taxes or better yet, are able to use the tax code to their advantage — and to a world where in reality, unemployment and slow economic growth are not due to high taxes but to other factors.
Occupy Wall Street is about highlighting these facts, seeking to reintroduce the simple concept that capitalism is meant to facilitate democracy and not vice versa.
Saturday, November 12, 2011
The Clock Ticks: History, Unemployment, and Presidential Elections
Less than one year to the 2012 elections. Less than 60 days to the New Hampshire primary. Barely 50 days to the Iowa caucuses. The official presidential race is upon us. But as the clock ticks, time is running out for Obama and history is against him. The basic problem is the economy. Only 80,000 jobs were added in October, placing the unemployment rate at 9.0%. The Federal Reserve Board projects slow economic growth next year–2-2.5%–with the unemployment rate settling in at about 8.5% by election time. Of course these numbers are bad for all those looking for jobs or businesses hoping to grow, yet for Obama it is a real problem.
Since 1932 only two presidents have ever won re-election when the unemployment rate was above 6%. In 1936 and 1940 Franklin Roosevelt won reelection with unemployment rates of 17% and 14.6%, but both of these elections should be treated as outliers or oddities. In 1936 the unemployment rate had dropped from nearly 24% to 17% and the economy was growing at an annual rate of 14%. In 1940 World War II was upon America and with patriotism high, support for Roosevelt was strong. More importantly, the economy was growing at 10% but the perception was that the president had the country going in the right direction.
In 1984 Ronald Reagan won re-election with an unemployment rate of 7.5%. Yet his victory occurred when the economy was growing at more than 11% and gas prices were tumbling from then record highs. Reagan definitely benefited from the perception that it truly was morning in America, especially after the unemployment rate tumbled from around 10% in 1982 and 1983.
But FDR and Reagan aside, high unemployment–six percent or more–is the death knell for a presidential re-election bid. In 1976 Gerald Ford ran for re-election when the unemployment rate was 7.7%–he lost to Jimmy Carter. Four years later the unemployment rate was 7.1% when Carter ran for a second term against Reagan. He lost to the tune of Reagan asking Americans if they were better off now than they were four years ago. In 1992 George Bush sought a second term with an unemployment rate of 7.5%–he lost to a Bill Clinton reminding the voters that it was “the economy stupid.” Conversely, Nixon won with an unemployment rate of 5.6% in 1972, Clinton 5.4% in 1996, Bush in 2004 with 5.5%, Eisenhower 4.1% in 1956, and Truman in 1948 with 3.8%.
Obama faces an economy where the best projection is of high unemployment and low economic growth. But there is more. Home values remain about 25% or more below what they were in 2008, consumer and now student debt is high, and many people have already blown through their unemployment benefits and face an uncertain future. Consumer confidence remains near historic lows, suggesting little chance that retail sales and spending for the coming holidays and into next year will revive the economy. The public just does not believe the country is headed in the right direction and few think we are better off now than four years ago.
History suggests Obama will lose. This assumes the Republicans put up a viable candidate with a compelling narrative. Yet so far that task seems elusive. Bachmann has come and gone. Perry has gaffed himself to death. Cain’s numbers place him in the GOP lead, but his negatives are escalating as it becomes more apparent that he is a misogynist who treats every woman in a demeaning fashion. Romney is boring and the Republican base does not really know where “multiple choice Mitt” stands on the issues. Gingrich is too acerbic. Congressional approval is less than 10%, with the public placing more blame on the Republicans than Obama for the gridlock in Washington. In short, the Republicans have the Democrats' disease—they are poised to snatch defeat from the jaws of victory. Obama can still win—he has money, the bully pulpit, and demographics that place perhaps as many as 200 or more electoral votes in easily into his presidential win column without too much effort. Now all he needs is the narrative for his re-election.
Obama hopes for a rerun of the 1948 Truman surprise victory over Dewey, campaigning hard as an economist populist against a hapless elitist. Yet the 1948 campaign featured an economy far better than 2012 so the parallels here might not be good.
Obama is also running on the fear factor—Hope that the American public will be afraid of an extremist Republican president presiding over a Republican Congress. Fear came be a powerful too, but 1980 demonstrated with Carter was up for re-election, fear of a crazy Reagan who would blow up the world was pushed aside by the desire for change and disgust with the status quo. Obama knows the public wants change—as he promised in 2008—but it is hard to run on that narrative when you an incumbent seeking re-election. He needs to navigate a message that promises change while staying the course with him. It’s a hard task—made only more difficult by the unemployment numbers—but Reagan and FDR did it, and now Obama needs to figure out how to channel their magic to do the same.
Saturday, November 5, 2011
The Legal Football Field: Forcing the Vikings to Stay in Minnesota
Does a snow-collapsed Metrodome mean the Vikings are on the hook for another season in Minnesota? Quite possibly according to the 1979 contract between the team and the Metropolitan Sports Facilities Commission (MSFC). Yet while the news of the day suggests this is the case, as does the 2002 litigation surrounding the Twins and the Dome, there is no certainty that a court would force the team to stay on another year. At stake here are complex legal issues and principles worth reviewing and clarifying.Monday, October 31, 2011
The Hype on Taxes: They Don’t Matter Much
Taxes impede economic growth. This is the belief among the Republican presidential contenders as they offer plans to cut taxes as a panacea to stimulate the economy. Herman Cain’s “9-9-9” assumes lower income tax rates for corporations and individuals will stimulate the economy. Newt Gingrich wants to cap top rates at 15% and Rick Perry has called for a national flat tax of 20%. Mitt Romney has a 59 point plan that includes tax cuts. Ron Paul wants a constitutional amendment to eliminate income and estate taxes. Michele Bachmann wants a return to the Reagan era tax cuts. All want to make the Bush era tax cuts permanent.Yet do high taxes really hurt the economy as much as they believe, and will lowering them have much of an impact on stimulating it? The economic literature is clear — tax breaks to encourage economic relocation or investment decisions are inefficient and wasteful. Hundreds of studies reach this conclusion. When businesses are surveyed regarding factors important to their investment decisions, taxes often come in behind proximity to markets, suppliers, and the quality of the labor force. These other factors occupy a larger percentage of a business's budget than do taxes, and all of them are far more critical to long-term success than are taxes. Businesses occasionally admit this. Nearly 62 percent of those interviewed in a California study on hiring tax credits indicated that they had never or rarely affected their decision to employ individuals. Speaking at a recent chamber of commerce event, I asked business leaders whether the Obama tax cuts would encourage them to hire. Unanimously the response was no—they were unwilling to hire until such time that consumers were willing to buy their products and services.
Anecdotal stories and illustrations also confirm the tax fallacy. High tax states such as Minnesota have generally fared better in terms of economic growth, unemployment, median family incomes, and location of Fortune 500 companies, than low tax ones such as Mississippi and Alabama. In many situations high taxes, and with that, government expenditures on education, workforce training, and infrastructure, correlate positively with income, low unemployment, and business retention. One needs to look not just a one side of the equation—taxes—but the other side too—what taxes buy—to see what value businesses get out of them in terms of educated workforces and infrastructure investments. Most debates fail to do this.
Bureau of Economic Analysis statistics demonstrate how economic growth is related to tax rates. One can compare annual economic growth as measured by the percent change in the gross domestic product (GDP) percent based on current dollars to the highest federal individual tax rate and the top corporate tax rate since 1930. If taxes are a factor affecting economic growth, one should see an inverse relationship between growth of the U.S. economy and higher tax rates. The GDP should grow more quickly when top individual and corporate tax rates are lower. If taxes are a major factor deterring economic growth, lines on a graph should go in opposite directions: As tax rates go up the GDP should go down.
No such pattern emerges between high taxes and GDP growth over 80 years. During the Depression of the 1930s corporate and individual taxes rates increased, but in 1934 through 1937 the GDP grew by 17%, 11%, and 14% annually. Top corporate tax rates climbed to over 50% through the 1960s, again with no discernable pattern associated with decreased economic growth. The same is true with top tax rates on the richest which were 91% into the 1960s. Conversely, since the 1980s after Kemp-Roth and then after 2001 with the Bush era tax cuts, there is no evidence that the economy grew more rapidly than in eras with significantly higher tax rates on the wealthy and corporations. Looking at time periods when tax rates were at their highest, GDP often grew more robustly than when taxes were cut. Visually, the attached graph simply fails to demonstrate that tax rates negatively impact economic growth. (Click on the graph to get a better view of it).
Pictures are worth a thousand words, but statistics are priceless. Statistically, if a tax hurts economic growth, the correction with it is -1. If they positively facilitate growth the relationship is 1, and if they have no impact the relationship is 0. The correlation between GDP and top individual taxes is 0.29, between GDP and top corporate taxes is 0.32, and among the three it is 0.14. Statistically, there is a slight positive impact on either top individual or corporate taxes or economic growth, but overall almost no connection between tax rates on the wealthy and corporations and economic growth in the United States.
But what about taxes as job killers? Again running similar statistical tests, there is little connection. Using Bureau of Labor Statistics data on unemployment rates since 1940, the correlation among top individual and corporate taxes and the annual unemployment rate is -0.02—essentially no connection at all.
The simple claim of Perry, Cain, and others that high tax rates on the wealthy and corporations hurt economic growth and job production is false. The evidence is simply not there to support assertions that high taxes alone hurt the economy or that cutting them will have the stimulus effect asserted.
Friday, October 28, 2011
A plea for fact-based policymaking in an era of political myths
Saturday, October 22, 2011
Michele Bachmann's Meltdown
The Iowa presidential caucuses of January 3, 2012 are less than 75 days away and their outcome are more in doubt today than ever. What once looked like a certain victory for Michele Bachmann now looks less and less likely, and talk of her presidential prospects sounds more like a deathwatch especially in light of the resignation of her New Hampshire staff.August 13, 2011 seems so distant now. Barely nine weeks ago Bachmann surprised many by winning the Ames straw poll. She was on top of the world, leading the GOP pack as the darling of the Tea Party. But then came the collapse. Rick Perry entered the race eating at her conservative base. Bachmann was unable to move to the center given her rhetoric and positions, and she disavowed any intention to do so. Media attention and scrutiny mounted, missteps and statements about HPV and retardation damaged her, and the cycle of decline began.
But now she is losing even in Iowa. Evidence is seen in the polls and in other candidates now returning to it to campaign with the belief they can win the state. She is falling back in the pack. She increasingly looks more like Rick Santorium than a leader in Iowa. She gives speeches to a few faithful but continues to slip in the polls. She has little new to say and the buzz she once had is gone. She has been unable to take advantage of Perry’s drop and instead Cain has benefitted. While potentially she can recover to win Iowa, the new January 3 date gives her less time to do that. Thus, an earlier Iowa date gives Bachmann too little time to recover and her dismal fund raising and failure to plan beyond Iowa make it unlikely she can go much further beyond Iowa.
Does Bachmann return to run for her congressional seat again? Maybe, she has until June to decide. But redistricting uncertainty and the prospects of a less friendly set of lines for the sixth district pose challenges. Moreover, the worse her presidential campaign looks the more it makes her potentially vulnerable to a primary challenge. Bachmann has never attracted big donors and if she were to run for Congress again her small donors may be tapped out or unwilling to give. She is in a bad situation right now and her options are ticking away along with the clock to Iowa.